Research target · ASO validation · Not a consumer ingredient
Stage 01 · Cancer cells
TWIST1 is Assay-Ready
Strong enough baseline expression for ASO screening to advance.
- Background: TWIST1 is a gene target for RNA-modulation research, not a drug, supplement, peptide, or topical ingredient.
- Baseline gate passed: BT-549 cells expressed TWIST1 at Cq 21.30-21.91, leaving enough dynamic range to measure ASO knockdown.
- Hair biology is plausible: TWIST1 appears in dermal papilla, progenitor, AGA, and mouse hair-cycle datasets, but the therapeutic direction is still unsettled.
- Consumer claim is premature: no TWIST1-directed ASO has shown hair regrowth in human follicles, scalp explants, or patients.
Internal RT-qPCR analysis · BT-549 baseline cDNA · technical duplicates across four assays · Prepared 02 June 2026
The knockdown screen
10 TWIST1 ASOs Screened
With BT-549 cleared as a screening line, ten antisense oligonucleotides (ASO10–ASO19) were transfected at 100 nM and 1 µM. TWIST1 was measured by qPCR, normalized to the geometric mean of HPRT1 and RPL13A and expressed relative to the non-targeting control (NTC = 1.0). Three candidates silence TWIST1 strongly and reproducibly across the 10× dose range, but knockdown magnitude alone does not pick the lead.
Reading it: shorter bar = more silencing, against the dashed NTC = 1.0 line; dots are the two qPCR wells, whiskers ±SD. ASO10, ASO16 and ASO17 drop furthest. The ▲ marks ASO10 and ASO16, the deepest knockdowns, but flagged for toxicity below; bars at or above the line show no knockdown. Screening tier (n = 2 wells/dose); confirmatory replication underway.
- ASO17: 65→75% knockdown, 100 nM → 1 µM (tolerability-aware lead)
- ASO15: 28→48% knockdown, best-tolerated (backup)
- ASO10 / ASO16: deepest knockdown (≈81–90%) but flagged for toxicity
Which hits are real
A real hit silences at both doses
Plotting each candidate's knockdown at 100 nM against 1 µM separates the dependable silencers (upper-right, on the diagonal) from one-off or noisy results. ASO10, ASO16 and ASO17 cluster top-right, reproducible across a 10× dose range, while ASO11 and ASO12 fall far off the line and are not trustworthy hits.
Each point is one ASO (number = ID); colour = knockdown strength. Near the diagonal means the candidate behaves the same at both doses.
| ASO | KD 100 nM | KD 1 µM | Tolerability | Recommendation |
|---|---|---|---|---|
| ASO10 | 87% | 90% | stressed (5.8× less RNA) | strong KD · toxicity flag |
| ASO16 | 64% | 81% | mild stress (2.0× less RNA) | strong KD · toxicity flag |
| ASO17 | 65% | 75% | clean | LEAD |
| ASO15 | 28% | 48% | clean | backup · tolerated |
| ASO13 | 15% | 50% | clean | - |
| ASO11 | 83% | -36% | mild stress (2.2× less RNA) | - |
| ASO14 | -32% | 54% | mild stress (1.6× less RNA) | - |
| ASO19 | 18% | 0% | stressed (2.6× less RNA) | - |
| ASO18 | -11% | 12% | stressed (2.4× less RNA) | - |
| ASO12 | 22% | -95% | stressed (3.1× less RNA) | - |
Sorted by knockdown; the lead is not the top row. Tolerability = reference-gene input recovered vs NTC at 1 µM. Recommendation integrates knockdown and tolerability.
Tolerability decides the lead
The strongest knockdown isn't the lead
A TWIST1 ASO is only useful if it silences the gene without harming the cells. Pairing each candidate's knockdown with how much reference-gene signal it left behind (a proxy for surviving cells) splits the strong silencers cleanly. ASO17 reaches 75% knockdown at 1 µM with its RNA input intact; ASO10 and ASO16 silence harder but recover ~5.8× and ~2× less RNA, a cell-loss fingerprint that matches the team's 48–72 h morphology flags. ΔΔCt corrects for input amount, but TWIST1 is itself stress-responsive, so a toxic well can move it independently of clean on-target activity.
Reading it: the best candidate sits far right (strong knockdown) and high up (kept its cells): the shaded zone. ASO17 lands there → lead; ASO15 is just as clean but silences less → backup; ASO10 reaches the deepest knockdown yet sinks to the bottom (~5.8× less RNA recovered), so its silencing is confounded by cell loss. Reference-gene input is a proxy. The team's 48–72 h morphology review is the primary toxicity evidence, and the two agree.
- Lead ASO17: strong knockdown + retained input + clean morphology
- Backup ASO15: tolerated, weaker knockdown
- ASO10 / ASO16: knockdown confounded by stress, not clean leads
The screen's controls held
Two internal checks confirm the screen reads true. The MALAT1-targeting control (MAL) silenced its own MALAT1 target by ~73% while leaving TWIST1 essentially untouched: on-target, specific knockdown rather than a transfection artifact. Separately, the 300 nM dose arm failed technically: every gene, including the non-targeting control and both housekeepers, failed to amplify in that block, so it was excluded rather than misread as biology.
- Specificity: MAL → ~73% MALAT1 knockdown, ~0% TWIST1 change
- 300 nM arm excluded: global amplification failure incl. controls
- Knockdown values use the validated 100 nM and 1 µM data only
| Gene (NTC) | 100 nM | 300 nM | 1 µM |
|---|---|---|---|
| TWIST | 24.6 | 33.3 | 25.2 |
| RPL13A | 24.0 | n.d. | 22.6 |
| HPRT1 | 24.7 | n.d. | 24.3 |
| MALAT1 | 20.1 | n.d. | 20.0 |
The non-targeting control carries no TWIST1 biology, so its Cq should be flat across doses. At 300 nM every gene fails or jumps ~10 cycles (n.d. = not detected).
The gating question
Is there enough baseline TWIST1 to screen?
Before any knockdown can be measured, the screening cell line must express enough TWIST1 at baseline that a real reduction is detectable above assay noise. This run answers that gating question for BT-549.
The answer from this baseline run is yes. The assay does not prove a hair-growth treatment; it proves the selected cell line has a measurable TWIST1 transcript pool before knockdown work starts.
- If baseline expression is marginal - a late Cq near the limit of detection - even a genuine knockdown collapses into the background and cannot be quantified.
- BT-549 is a triple-negative breast carcinoma line widely used as a high-TWIST1 mesenchymal model, which is why it was selected as the screening substrate.
- The run also validates the cDNA quality, the reference-gene panel, and the no-template / no-RT controls that every downstream knockdown plate will depend on.
Assay panel
- TWIST1 - primary target. Confirms BT-549 has enough baseline expression for ASO knockdown screening.
- HPRT1 - housekeeping / reference gene. Checks cDNA quality and anchors normalization.
- RPL13A - second housekeeping gene. Confirms consistent cDNA input and supports normalization with a reference pair.
- MALAT1 - positive-control assay (a highly abundant lncRNA). Confirms the RNA, cDNA, and qPCR setup all worked.
Sample and instrument
- RNA was extracted from baseline BT-549 wells and frozen on 31 May 2026.
- On 02 June 2026, RNA was reverse-transcribed to cDNA and run by RT-qPCR.
- Instrument: QuantStudio 6 Pro, 96-well 0.2-mL block, FAM / NFQ-MGB chemistry, ROX passive reference, CT quantification method.
- QuantStudio Design & Analysis v2.6.0 / Primary Analysis v1.7.0; auto baseline/threshold; 88-minute run.
- Each sample was run in technical duplicate across four assays.
Samples and controls
- R1, R2, and R3 were three baseline cDNA preparations run in technical duplicate.
- No-RT tested for genomic-DNA or non-cDNA amplification.
- Water / NTC tested for reagent contamination.
- Lower Cq means more starting template.
- The pre-set adequacy bar for baseline TWIST1 was clear Cq below about 30; the report treats that as an internal screening convention.
Baseline qPCR
All four assays amplified below the adequacy line
Every assay amplified far below the Cq 30 adequacy line, and the three baseline samples tracked each other closely. TWIST1 - the gene that actually has to be expressed for the program to work - came in at Cq ~21.3–21.9, indicating a large baseline transcript pool.
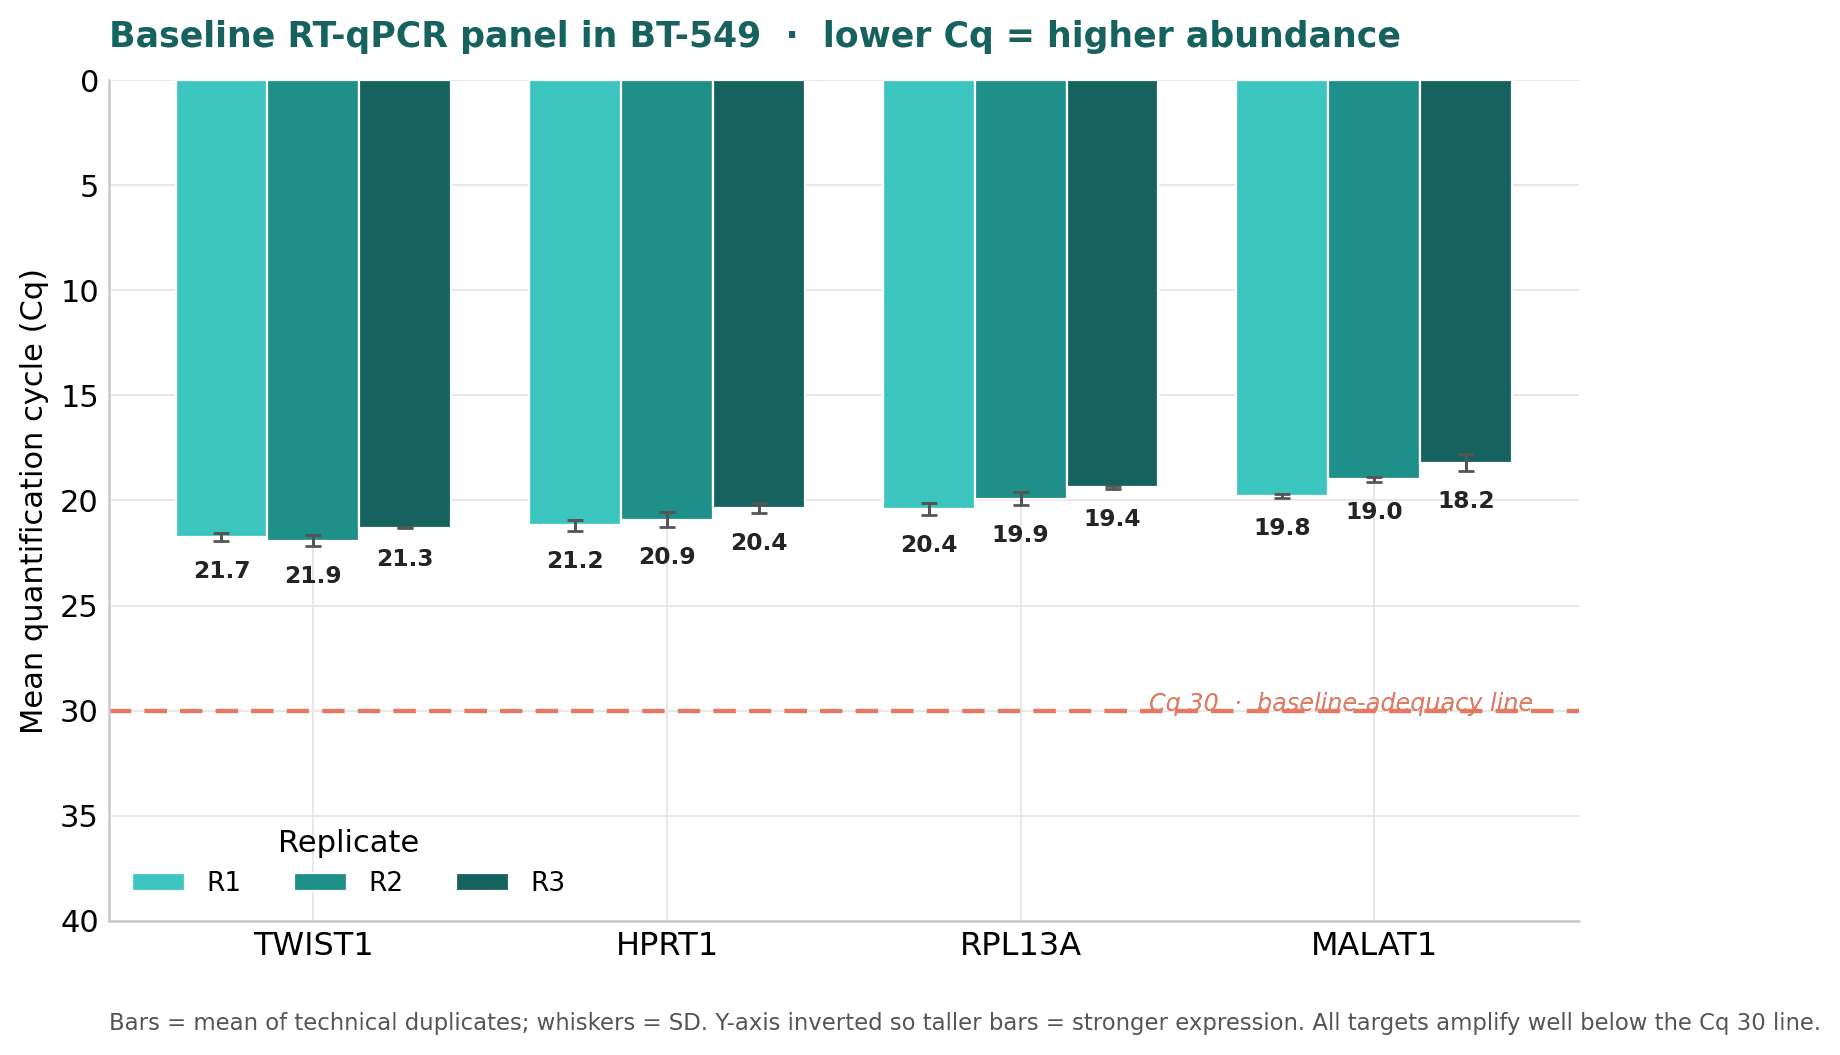
| Assay | R1 (mean ± SD) | R2 (mean ± SD) | R3 (mean ± SD) |
|---|---|---|---|
| TWIST1 | 21.72 ± 0.19 | 21.91 ± 0.25 | 21.30 ± 0.04 |
| HPRT1 | 21.18 ± 0.27 | 20.91 ± 0.37 | 20.37 ± 0.24 |
| RPL13A | 20.43 ± 0.28 | 19.91 ± 0.30 | 19.38 ± 0.08 |
| MALAT1 | 19.79 ± 0.11 | 19.00 ± 0.12 | 18.21 ± 0.41 |
Means and SDs are calculated from technical duplicates. All assays clear the internal Cq ~30 baseline-adequacy line.
Specificity and controls
True TWIST1 signal sits about 14-16 cycles above background
A low Cq only matters if it is real signal and not background. The gap between true template and the controls is the test. For TWIST1, the three samples amplified at Cq ~21–22 while the no-RT control did not rise until Cq ~36 and the water/NTC until Cq ~38 (flagged Inconclusive). Each cycle is roughly a doubling, so a ~14.5-cycle gap is on the order of a 23,000-fold separation between real signal and background - a wide, comfortable margin.
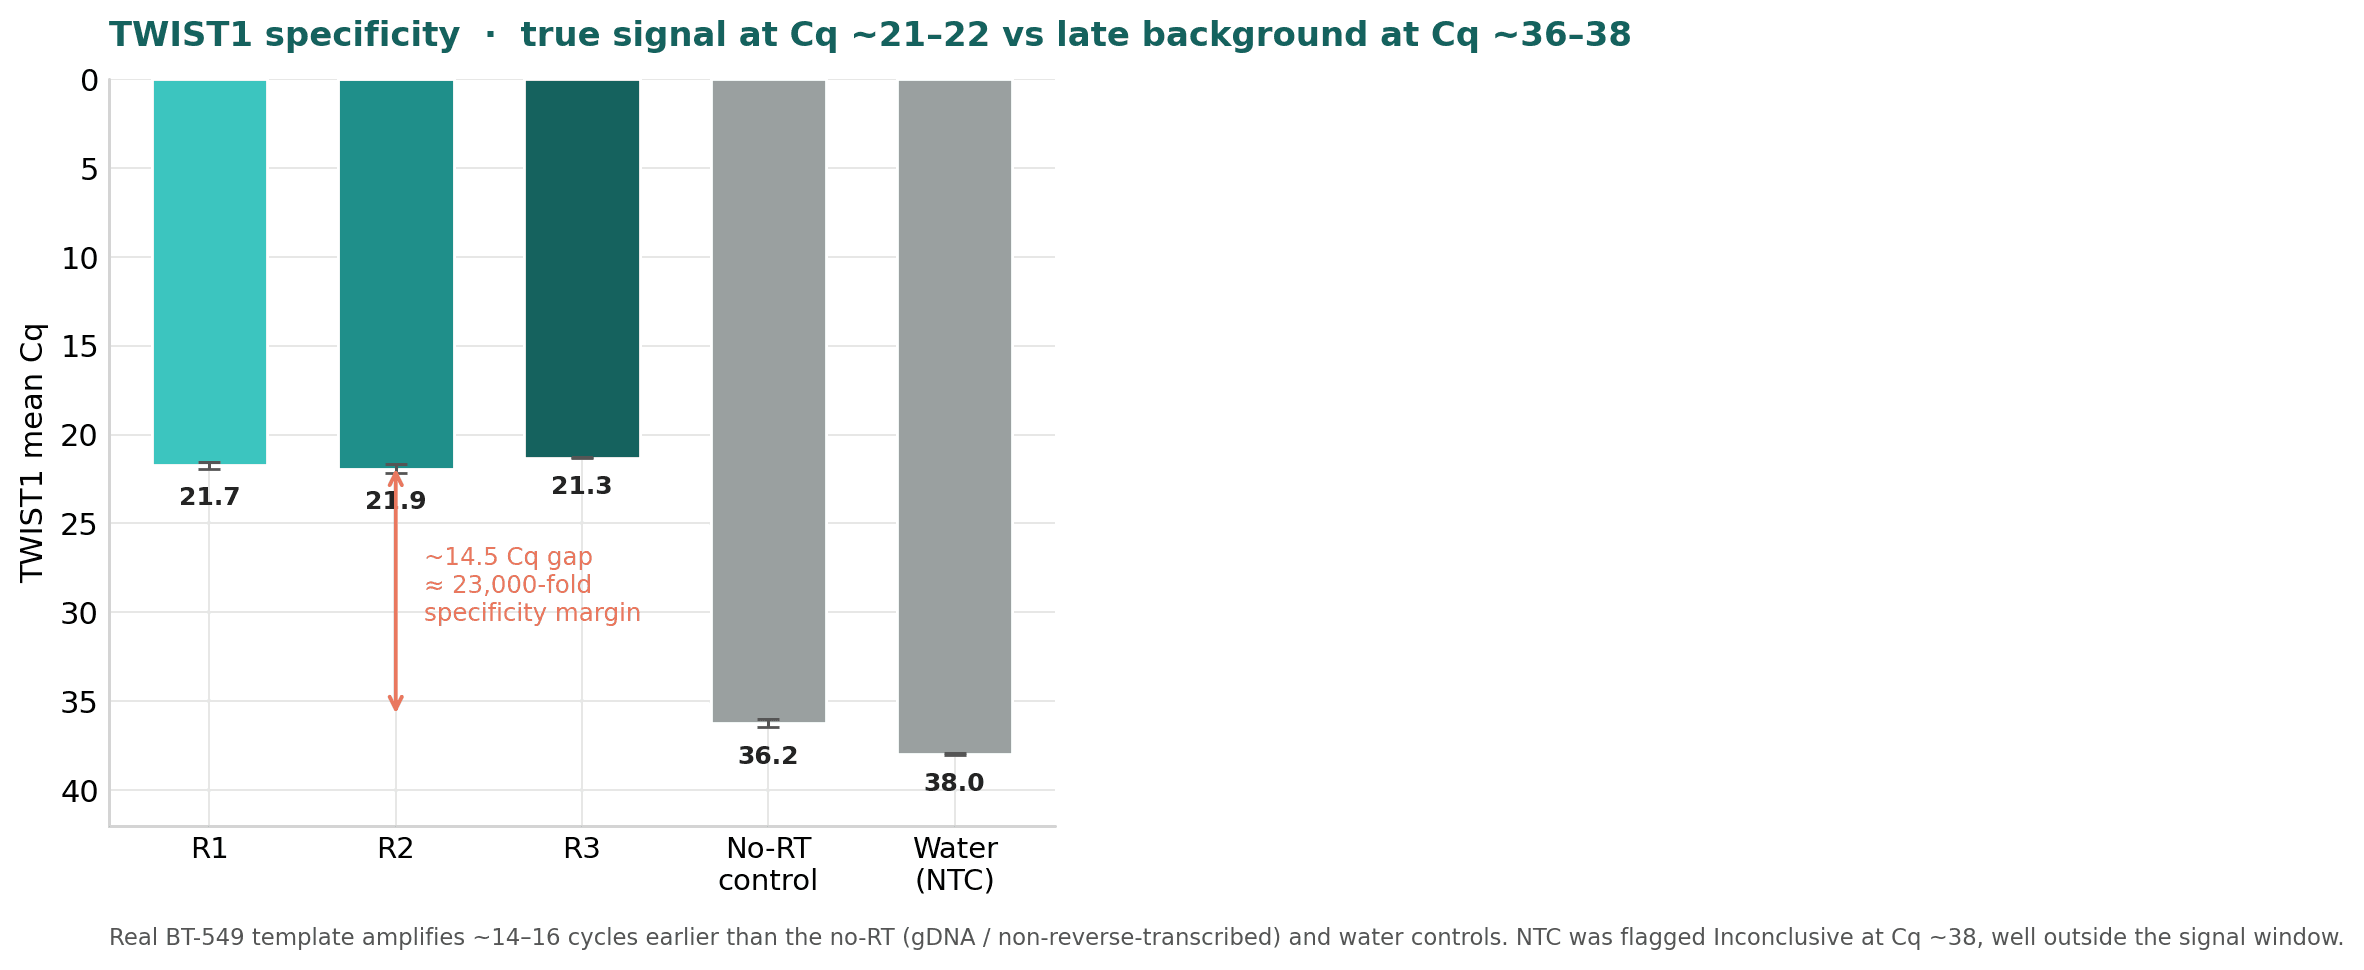
Control interpretation
- Water / NTC - clean. No amplification for HPRT1, RPL13A, or MALAT1. TWIST1 showed only very late, Inconclusive signal at Cq ~38, far outside the true-signal window - consistent with trace background, not contamination.
- No-RT - acceptable. HPRT1 and RPL13A no-RT wells did not amplify (no detectable genomic-DNA carryover). TWIST1 and MALAT1 showed late no-RT signal at Cq ~36, ~14–18 cycles after true template - negligible relative to the Cq ~18–22 sample signal.
- Bottom line on controls: the late background in the TWIST1 controls (Cq ~36–38) is far removed from the real sample signal at Cq ~21–22 and does not compromise the baseline call.
| Assay | R1 | R2 | R3 | No-RT | NTC |
|---|---|---|---|---|---|
| TWIST1 | 21.86 / 21.59 | 22.09 / 21.73 | 21.27 / 21.32 | 36.09 / 36.41 | 37.91 / 38.00 |
| HPRT1 | 21.37 / 21.00 | 21.17 / 20.65 | 20.20 / 20.54 | Undet. / Undet. | Undet. / Undet. |
| RPL13A | 20.63 / 20.23 | 20.12 / 19.70 | 19.32 / 19.43 | Undet. / 36.49 | Undet. / Undet. |
| MALAT1 | 19.87 / 19.71 | 19.08 / 18.91 | 18.50 / 17.92 | 36.13 / 35.83 | Undet. / Undet. |
All quantification cycles as exported from QuantStudio Design & Analysis v2.6.0. 'Undet.' = Undetermined (no amplification call). NTC TWIST1 wells were flagged Inconclusive.
Reference normalization
TWIST1 sits near the HPRT1/RPL13A reference pair
Normalizing TWIST1 to the geometric mean of the two housekeeping genes (HPRT1 and RPL13A) removes input-amount differences between samples and expresses TWIST1 relative to genes of known, stable abundance. The resulting ΔCt was ~0.9–1.5, meaning TWIST1 sits within roughly one-and-a-half cycles of the reference genes. On the linear scale (2^-ΔCt) that is ~0.35–0.53, i.e. TWIST1 is expressed at about 35–53% of the housekeeping-gene level - a large baseline pool, not a trace transcript.
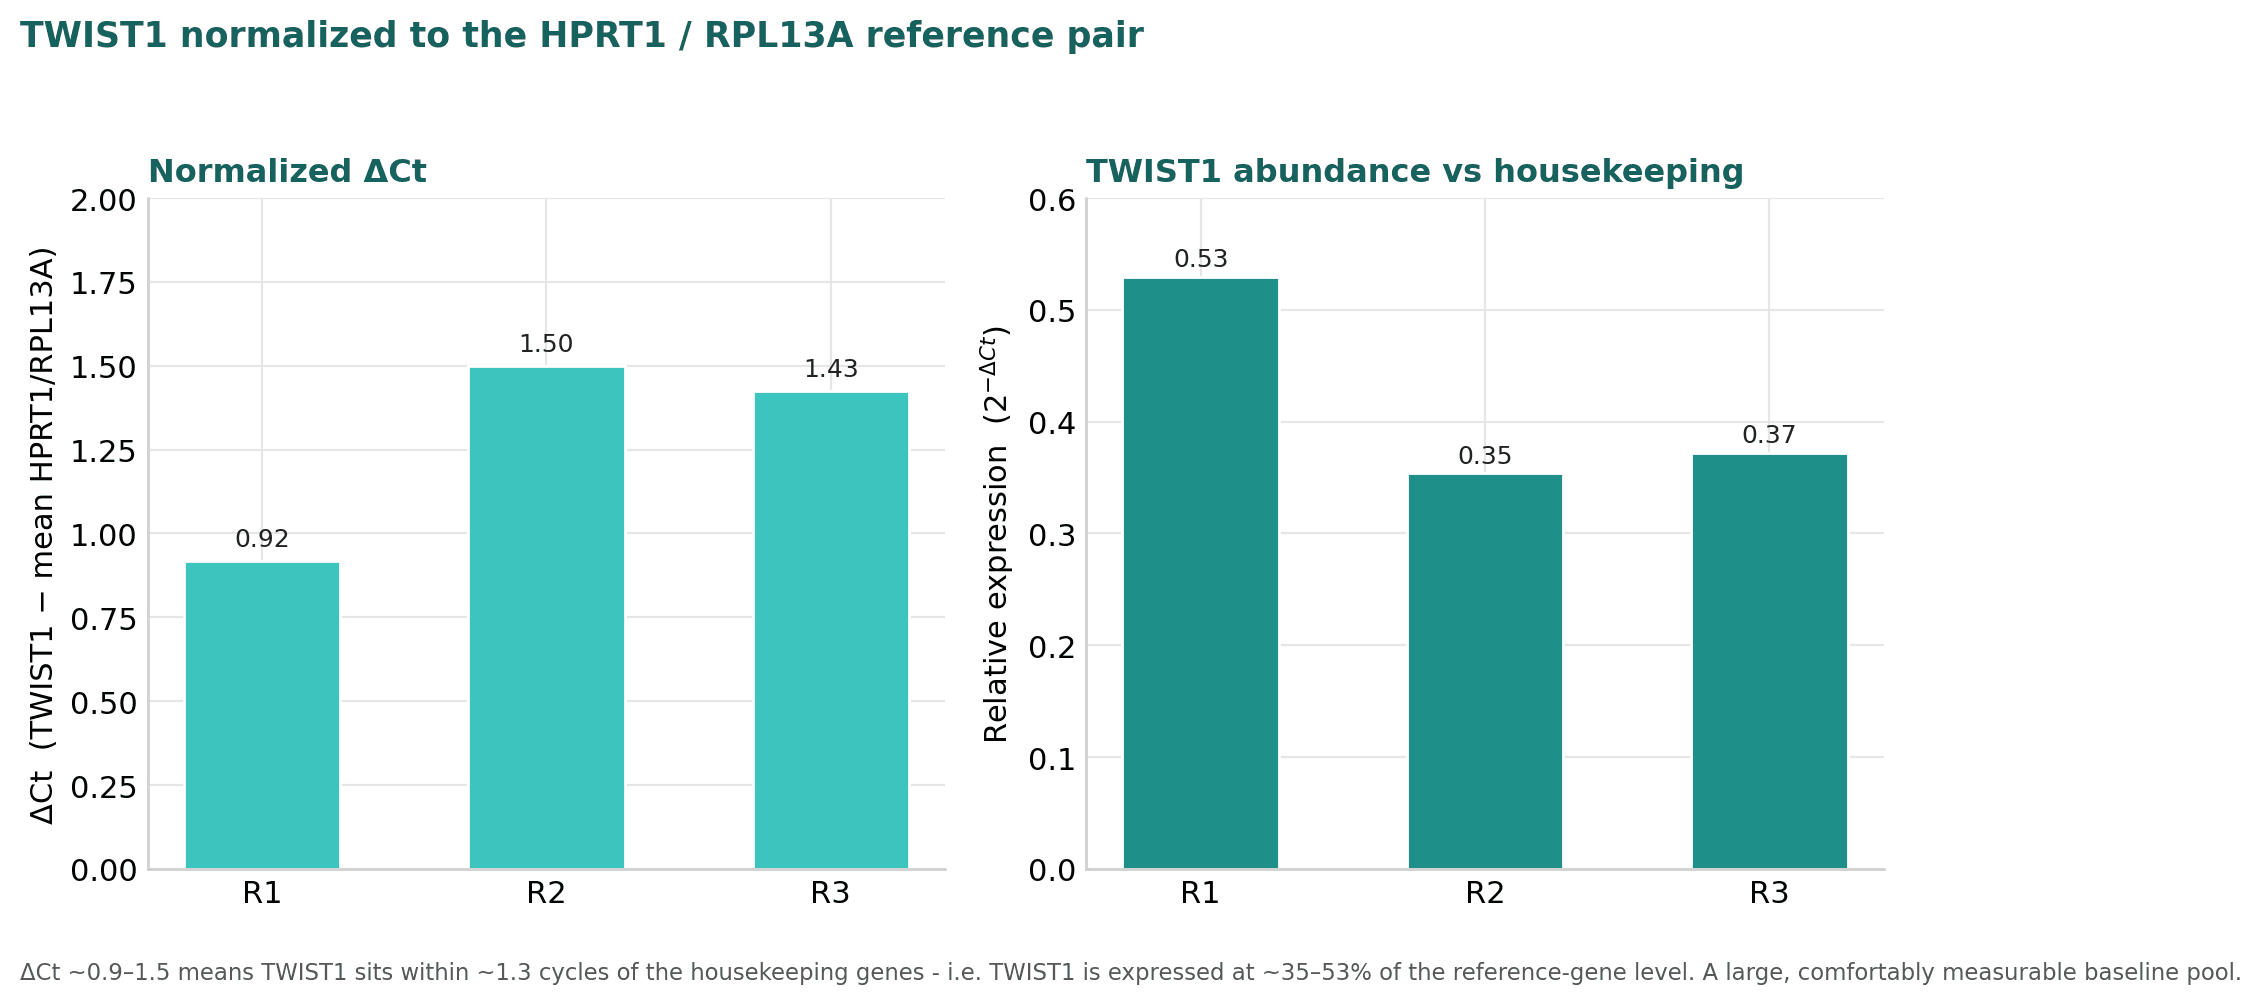
| Sample | Reference mean Cq | ΔCt | 2^-ΔCt |
|---|---|---|---|
| R1 | 20.805 | 0.915 | 0.530 |
| R2 | 20.410 | 1.500 | 0.354 |
| R3 | 19.875 | 1.425 | 0.372 |
| Mean | - | 1.280 | 0.419 |
ΔCt = Cq(TWIST1) − mean[Cq(HPRT1), Cq(RPL13A)]. Relative expression = 2^-ΔCt.
| Parameter | Value |
|---|---|
| Cq summarization | Mean and SD computed across technical duplicates per sample/assay |
| Normalization | ΔCt = Cq(TWIST1) − mean[Cq(HPRT1), Cq(RPL13A)] per sample; relative expression = 2^(−ΔCt) |
| Mean ΔCt | 1.28 across R1–R3 |
| Mean relative expression | 0.42 by 2^-ΔCt |
| Specificity estimate | 2^(14.5) ≈ 2.3×10⁴ for sample Cq ~21.6 vs no-RT ~36.2 |
| Adequacy criterion | Baseline TWIST1 Cq < ~30 (internal screening convention) |
| Report assembly tools | Python 3 (numpy, matplotlib), openpyxl for .xlsx parsing, python-docx for assembly |
Technical reproducibility
Duplicate wells cluster tightly across the panel
Across every sample/target pair, the two replicate wells landed on top of each other. Tight duplicates mean the pipetting, the cDNA, and the amplification are repeatable, so the sample-to-sample differences seen above are real signal rather than technical scatter.
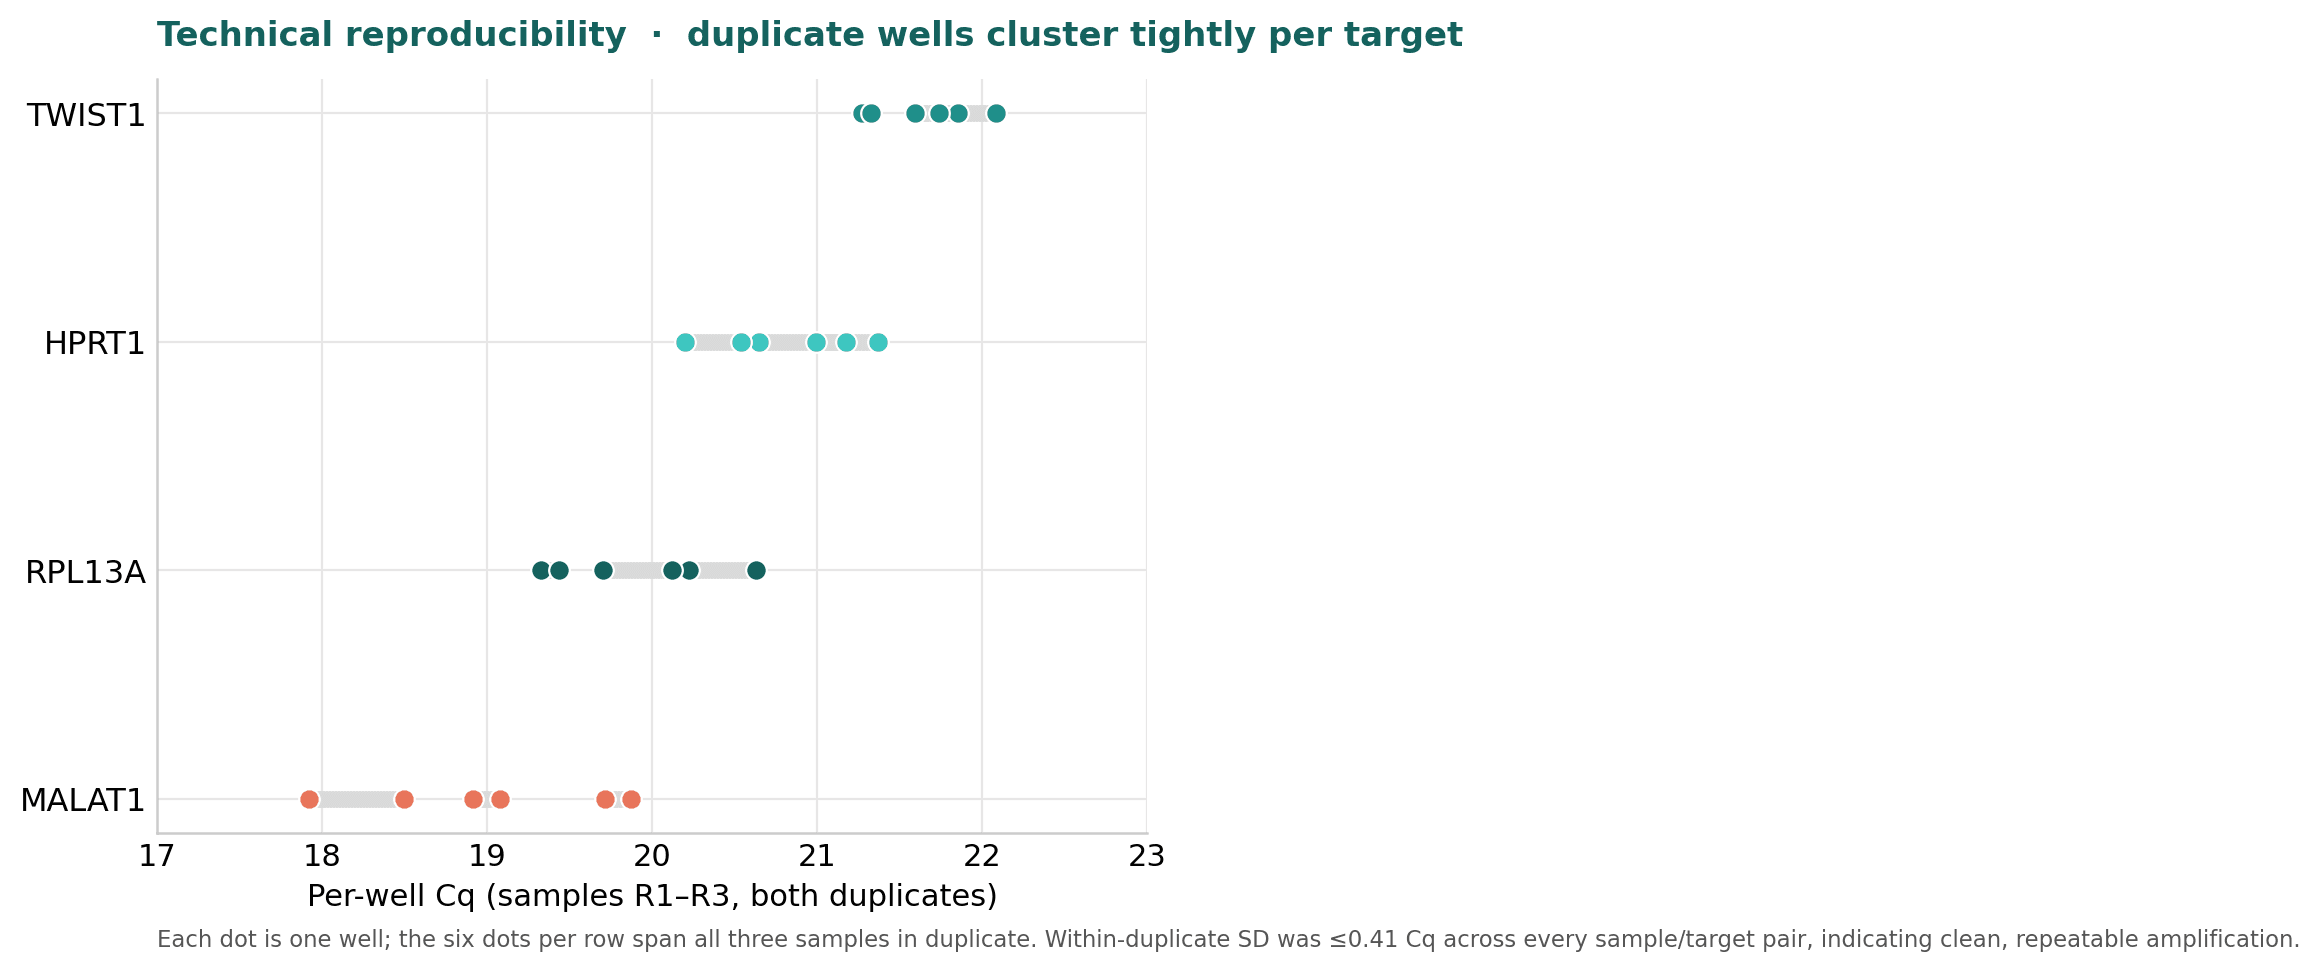
Technical reproducibility
- Within-duplicate SD was ≤0.41 Cq throughout the four-assay panel.
- For TWIST1 specifically, within-duplicate SD was ≤0.25 Cq.
- Each target ran across all three samples in duplicate (six wells per row) and clustered tightly, confirming clean, reproducible amplification.
Cell-line choice
BT-549 matched the top-of-panel prediction
Our prior internal review (the TWIST1 Knockdown Cell Line Landscape) ranked candidate screening lines by suspected baseline TWIST1. That ranking was literature-anchored and relative (a 0-10 score), not a portal-exported TPM value. BT-549, the line measured in this run, was ranked at the top of the shortlist, and the Cq ~21.5 measured here is consistent with that prediction.
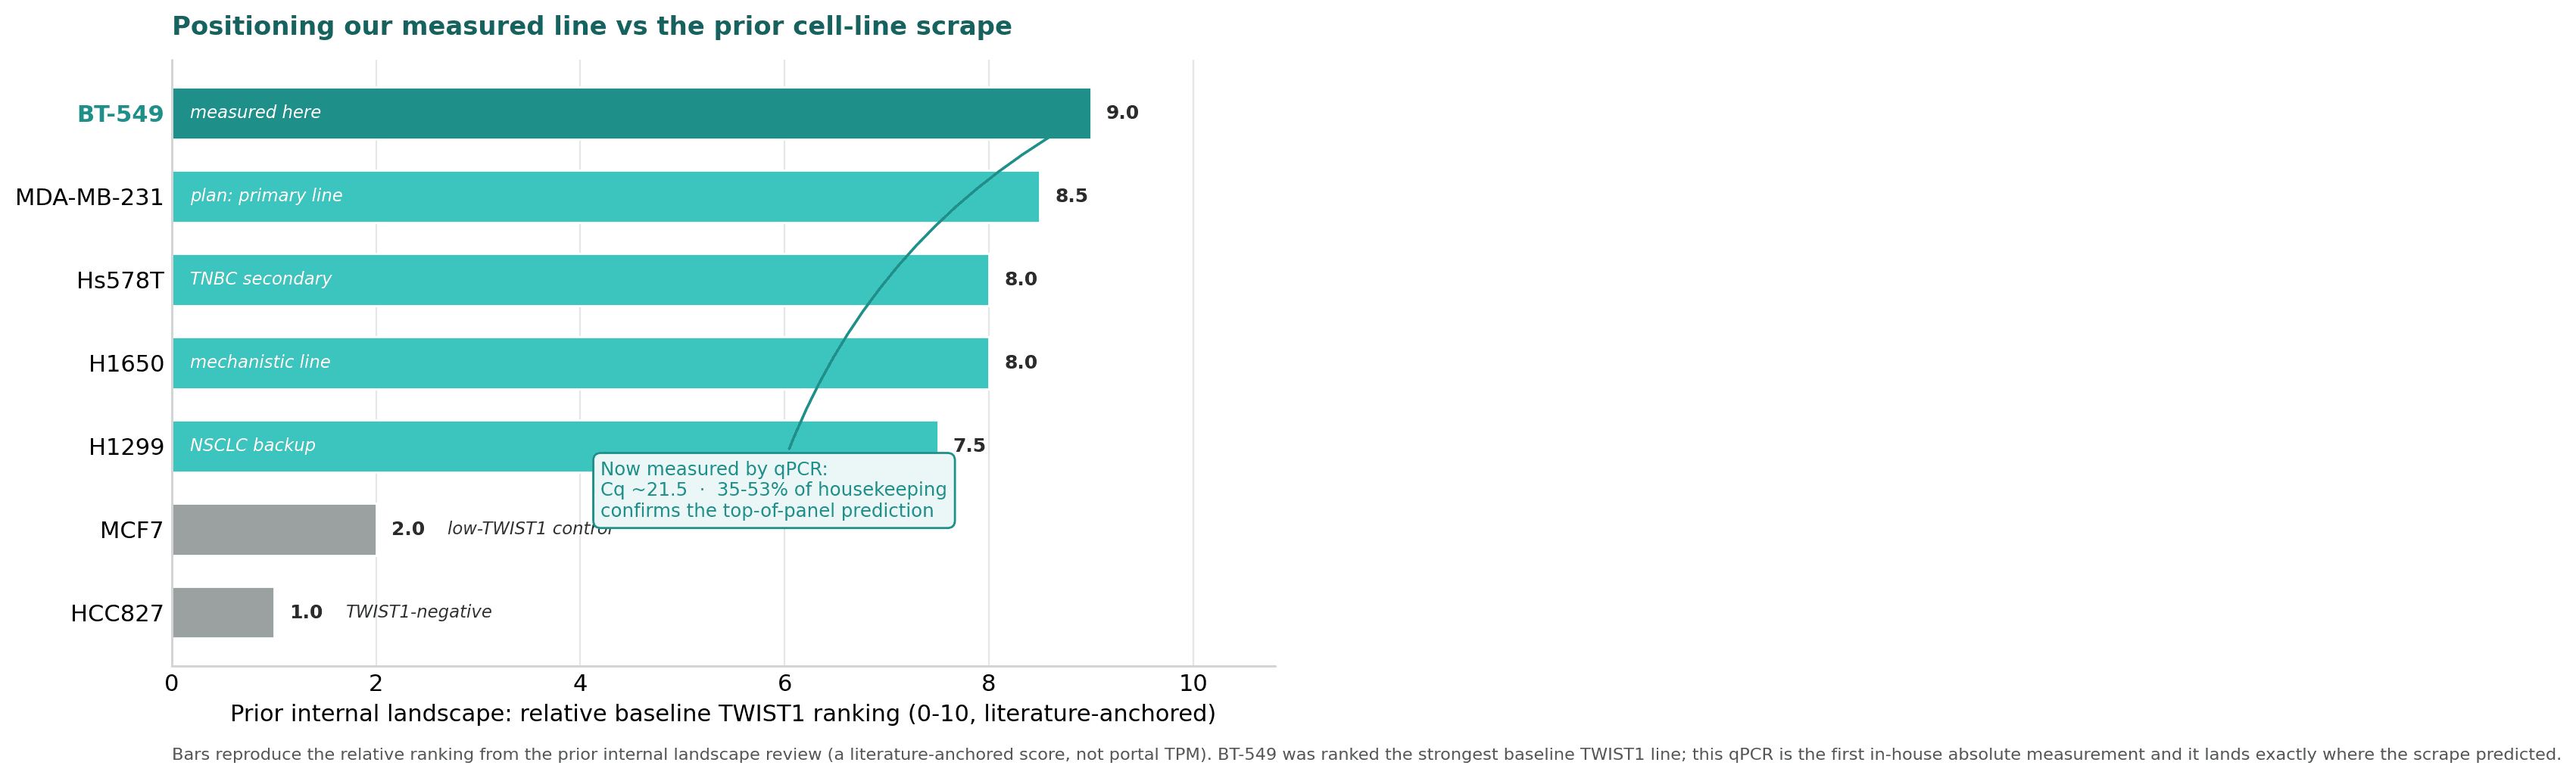
| Cell line | Suspected ranking (0-10) | Tissue / context | Role in our program |
|---|---|---|---|
| BT-549 | 9.0 | TNBC, basal / mesenchymal | Measured here; top of panel |
| MDA-MB-231 | 8.5 | TNBC, highly invasive | Planned primary discovery line |
| H1650 | 8.0 | EGFR-mutant lung adenocarcinoma | Orthogonal mechanistic line |
| Hs578T | 8.0 | TNBC, basal | TNBC secondary line |
| H1299 | 7.5 | NSCLC, p53-null, mesenchymal | NSCLC backup |
| MCF7 | 2.0 | ER+ breast, epithelial | Low-TWIST1 control |
| HCC827 | 1.0 | EGFR-mutant lung adenocarcinoma | TWIST1-negative control |
This is a relative literature-anchored ranking, not absolute expression, and our measured Cq is not plotted on the same axis. It supports the high-versus-low call for BT-549 rather than re-deriving each line's value.
Stage 02 · Hair cells
TWIST1 is abundant in human hair cells
The gene we are building an antisense drug to silence is one of the most abundant transcripts we can measure in primary hair follicle dermal papilla cells.
- Measured in the right tissue: primary human hair follicle dermal papilla cells, not a cancer line standing in for them.
- Above the housekeeping level: TWIST1 ran at 1.8-2.0x the HPRT1/RPL13A reference pair, and 7.9-9.1x HPRT1 on its own. The range is whether one outlier well is excluded.
- Higher than the cancer line: 4.2-4.9x the relative abundance measured in BT-549, which was chosen because it is a high-TWIST1 model.
- Direction is still open: abundance means we can measure knockdown. No ASO has been dosed into these cells yet.
Internal RT-qPCR analysis · HHDPC (PromoCell C-12071) · three preparations, technical triplicate · Prepared 24 July 2026
Hair-cell abundance
The target is not a rare transcript where it matters
Molecular biologists lean on HPRT1 as a yardstick because it is dependably present in almost any cell. In these hair follicle cells TWIST1 ran roughly eight to nine times above it, and landed between the two reference genes rather than below both. That is what makes a knockdown experiment readable: there is a large signal to lose before the assay floor.
| Preparation | TWIST1 | HPRT1 | RPL13A | dCt | 2^-dCt |
|---|---|---|---|---|---|
| R1 | 20.12 | 23.47 | 19.17 | -1.21 | 2.31 |
| R2 | 20.58 | 23.97 | 19.65 | -1.23 | 2.35 |
| R3 | 21.48 | 24.27 | 19.99 | -0.66 | 1.57 |
| Mean, all wells | 20.72 | 23.91 | 19.60 | -1.03 | 2.04 |
| Mean, excl. outlier | 20.93 | 23.91 | 19.60 | -0.83 | 1.77 |
dCt = Cq(TWIST1) minus the mean of HPRT1 and RPL13A. A negative dCt means TWIST1 is more abundant than the reference pair. The R1 TWIST1 wells read 18.88 / 20.66 / 20.81 - the first sits 1.8 cycles below its own triplicate and is a technical artifact rather than biology, since all three wells share one cDNA preparation. Excluding it tightens the R1 well SD from 1.073 to 0.101 and moves the result from 2.04x to 1.77x. Both means are reported above because the conclusion is the same either way.
Against the screening line
More abundant in hair cells than in the cancer line
BT-549 was chosen for the original screen precisely because it is a well-known high-TWIST1 model. Normalised the same way, against the same reference pair, the hair follicle cells came back higher. Real TWIST1 signal also arrived 15.2 cycles ahead of the no-RT control and 18.1 cycles ahead of water, so there is no meaningful background to subtract.
| Run | Cell type | TWIST1 Cq | dCt | 2^-dCt | Replication |
|---|---|---|---|---|---|
| 02 Jun 2026 | BT-549 breast carcinoma | 21.64 | +1.28 | 0.42 | 3 preps, duplicate |
| 24 Jul 2026 | HHDPC dermal papilla | 20.7-20.9 | -1.03 to -0.83 | 1.77-2.04 | 3 preps, triplicate |
Separate runs on different cell types, neither calibrated with a standard curve. The HHDPC range spans excluding and including the R1 outlier well. The four- to fivefold difference is a direction and a rough magnitude, not a precise fold-change.
What comes next
Abundance buys us dynamic range.
TWIST1 has been measured in dermal papilla cells before. Chew 2016 profiled it by microarray across balding and non-balding scalp, Yu 2020 tracked it by Western blot and immunofluorescence and carried no TWIST1 primer in its qPCR panel, and Charoensuksira 2025 mapped it by spatial transcriptomics in AGA scalp. Each of those answers whether TWIST1 shifts between conditions.
This run answers a different question: how much is there, quantified against stable reference genes in untreated cells. That number is what decides whether a knockdown is detectable at all, and it is the one an assay has to be designed around. As far as we can establish it is also the first time TWIST1 transcript has been quantified by PCR in primary human dermal papilla cells; none of the work above measured it that way.
The next experiment answers our ASO's efficacy in human dermal papilla cells directly. We dose the ASOs into these same cells and measure what happens to TWIST1: transcript by qPCR, protein by Western blot.
Target biology
Interesting follicle biology, unresolved directionality
TWIST1 is a basic helix-loop-helix transcription factor, not a topical ingredient. In cancer biology it is widely studied in EMT, invasion, metastasis, and recurrence programs. In hair biology, the signal is early but plausible: TWIST1 is expressed in dermal papilla and progenitor-associated follicle compartments, appears in AGA-linked dermal papilla/transcriptomic datasets, and mouse Twist1 loss-of-function extended anagen and accelerated hair growth after follicles had developed. The therapeutic hypothesis is that lowering TWIST1 mRNA with an ASO could modulate an AGA-relevant predicted TGF-beta/TWIST1/FN1 remodeling program. That hypothesis is not yet proven in human scalp.
TWIST1 is a gene target, not an ingredient
Correct classification: research target / ASO program, not a compound or ingredient.
TWIST1 has credible hair-follicle biological relevance
The target is biologically plausible, but the role is not simple enough to market as 'TWIST1 inhibition grows hair.'
Twist1 loss-of-function extended anagen and accelerated hair growth in mice
Strong animal rationale for testing TWIST1 suppression, but not human efficacy evidence.
Human AGA data implicates TWIST1, but mostly as association and pathway modeling
Human AGA datasets make TWIST1 worth screening, but they do not validate a TWIST1 therapy.
The program has not yet shown TWIST1-directed hair regrowth
Promising target-validation program, not a proven hair-loss treatment.
Safety boundary
No patient-facing TWIST1 use is supported
Internal target validation and ASO discovery only. Not a patient-facing treatment.
TWIST1 is a developmental transcription factor with context-dependent roles in skin, follicle, and disease biology. Baseline qPCR cannot answer dose, delivery, cell-type specificity, reproductive safety, local tolerability, or off-target questions.
The current decision is narrow: BT-549 can be used for ASO knockdown screening. Anything beyond that remains research.
No clinical hair-loss safety dataset
No TWIST1 ASO has been dosed as a hair-loss treatment in humans. Safety cannot be inferred from baseline qPCR.
Developmental biology concern
TWIST1 is a developmental transcription factor; germline TWIST1 mutations cause Saethre-Chotzen syndrome. Adult mouse knockout data lowers but does not eliminate concern for targeted adult modulation.
On-target skin biology uncertainty
TWIST1 has context-dependent roles in dermal papilla biology and AGA progenitor-region signaling. The desired direction, dose, cell-type specificity, and duration of suppression in scalp remain unresolved.
What remains unproven
Stay conservative. The program is early
These limitations are part of the data interpretation, not caveats added after the fact. They define what the qPCR run can and cannot support.
Single qPCR run on a single baseline RNA harvest (frozen 31 May 2026). Biological replication across independent passages/harvests is not yet established.
'n = 3' refers to three baseline cDNA samples in technical duplicate, not three independent biological replicates with separate cultures and extractions.
No standard curve / amplification-efficiency calibration was run, so the 2^-ΔCt values assume ~100% efficiency and are relative, not absolute, abundances.
Reference-gene stability (HPRT1, RPL13A) was assumed from prior use; it has not been formally validated under the transfection conditions the knockdown screen will use, where housekeeping expression can shift.
The Cq ~30 adequacy bar is an internal screening convention, not a validated biological threshold.
Screening tier. Knockdown is measured from n = 2 technical qPCR wells per dose; independent biological replication of the lead and backup is underway.
The 300 nM dose arm failed technically (no amplification across all genes including controls) and was excluded, so the dose-response is anchored on 100 nM and 1 µM only.
Tolerability is a reference-gene input proxy plus the team's 48–72 h morphology review, not a dedicated candidate-mapped cytotoxicity or proliferation assay.
Knockdown is measured at the transcript level; protein-level TWIST1 reduction (immunofluorescence / western) has not yet been confirmed.
Independent repeat of baseline TWIST1 qPCR across separate BT-549 passages and RNA harvests.
Standard curve / amplification-efficiency validation for TWIST1, HPRT1, RPL13A, and MALAT1 before reporting absolute fold-change confidence.
ASO transfection or electroporation optimization, including vehicle/scrambled controls, cytotoxicity window, and dose-response.
Demonstrated TWIST1 mRNA and protein knockdown with at least two independent ASO sequences.
Hair-relevant phenotyping after knockdown: DPC markers, Wnt/beta-catenin outputs, TGF-beta/FN1/ECM markers, apoptosis/senescence, and growth-factor secretion.
Demonstrated TWIST1 knockdown in human dermal papilla cells. Baseline expression is now measured there, but no ASO has been dosed into follicle cells, and outer-root-sheath/progenitor models, follicle organ culture, and scalp explants remain untested.
Sources
Primary references and internal assay record
Published biology anchors the target rationale; the internal assay record anchors the BT-549 baseline-expression gate.
- 1NCBI Gene TWIST1 twist family bHLH transcription factor 1 [Homo sapiens]. https://www.ncbi.nlm.nih.gov/gene/7291
- 2Yu N et al. Twist1 Contributes to the Maintenance of Some Biological Properties of Dermal Papilla Cells in vitro by Forming a Complex With Tcf4 and beta-Catenin. PMID 32974352doi:10.3389/fcell.2020.00824
- 3Chew EGY et al. Differential Expression between Human Dermal Papilla Cells from Balding and Non-Balding Scalps Reveals New Candidate Genes for Androgenetic Alopecia. PMID 27060448doi:10.1016/j.jid.2016.03.032
- 4Charoensuksira S et al. Progenitor Cell Dynamics in Androgenetic Alopecia: Insights from Spatially Resolved Transcriptomics. PMID 40565255doi:10.3390/ijms26125792
- 5Xu Y et al. Inducible knockout of Twist1 in young and adult mice prolongs hair growth cycle and has mild effects on general health, supporting Twist1 as a preferential cancer target. PMID 23906809doi:10.1016/j.ajpath.2013.06.021
- 6Anagen / HairDAO TWIST1 Baseline Expression in BT-549 Cells: RT-qPCR Validation Ahead of ASO Knockdown Screening.
- 7Anagen / HairDAO TWIST1 Baseline Expression in Primary Human Hair Follicle Dermal Papilla Cells: RT-qPCR, 24 July 2026.